Ichimoku Kumo Cloud Trading
$145.00
This is a confirmation line, a support/resistance line, and can be used as a trailing stop line.
Ichimoku Kumo Cloud Trading
Check it out: Ichimoku Kumo Cloud Trading
Ichimoku Kumo Cloud Trading [221 Video (FLV)]
About Ichimoku Trading System
Ichimoku Kinko Hyo is a technical analysis method that builds on candlestick charting to improve the accuracy of forecasted price moves. It was developed in the late 1930s by Goichi Hosoda, a Japanese journalist who used to be known as Ichimoku Sanjin, which can be translated as “What a man in the mountain sees”. He spent thirty years perfecting the technique before releasing his findings to the general public in the late 1960s.
Ichimoku Kinko Hyo translates to ‘one glance equilibrium chart’ or ‘instant look at the balance chart’ and is sometimes referred to as ‘one glance cloud chart’ based on the unique ‘clouds’ that feature in ichimoku charting.
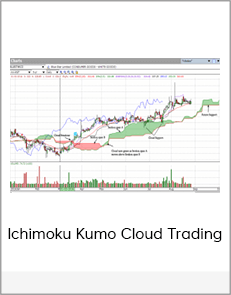
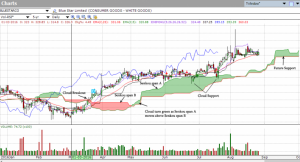
The key elements of the ichimoku chart
Tenkan-sen
Tenkan-sen calculation: (highest high + lowest low)/2 for the last 9 periods.
It is primarily used as a signal line and a minor support/resistance line.
Kijun-sen
Kijun-sen calculation: (highest high + lowest low)/2 for the past 26 periods.
This is a confirmation line, a support/resistance line, and can be used as a trailing stop line.
Senkou span A
Senkou span A calculation: (Tenkan-sen + kijun-sen)/2 plotted 26 periods ahead.
Also called leading span 1, this line forms one edge of the kumo, or cloud
Senkou span B
Senkou span B calculation: (highest high + lowest low)/2 calculated over the past 52 time periods and plotted 26 periods ahead.
Also called leading span 2, this line forms the other edge of the kumo.
Kumo
Kumo cloud is the space between senkou span A and B. The cloud edges identify current and potential future support and resistance points.
The Kumo cloud changes in shape and height based on price changes. This height represents volatility as larger price movements form thicker clouds, which creates a stronger support and resistance. As thinner clouds offer only weak support and resistance, prices can and tend to break through such thin clouds.
Generally, markets are bullish when Senkou Span A is above Senkou Span B and vice versa when markets are bearish. Traders often look for Kumo Twists in future clouds, where Senkou Span A and B exchange positions, a signal of potential trend reversals.
In addition to thickness, the strength of the cloud can also be ascertained by its angle; upwards for bullish and downwards for bearish. Any clouds behind price are also known as Kumo Shadows.
Chikou span
Chikou span calculation: today’s closing price projected back 26 days on the chart.
Also called the lagging span it is used as a support/resistance aid.
Full video rips from Ichimoku Kumo Cloud Trading channel. This is viewable ratio free at http://www.youtube.com/user/sunman4008 so download this torrent ONLY if you want to have all the videos without the trouble of downloading, converting, sorting and renaming.


![Mindvalley Academy [Gina DeVee] – Live & Luxurious Course](http://havecourse.me/wp-content/uploads/2020/04/Mindvalley-Academy-Gina-DeVee-–-Live-Luxurious-Course.jpg)


