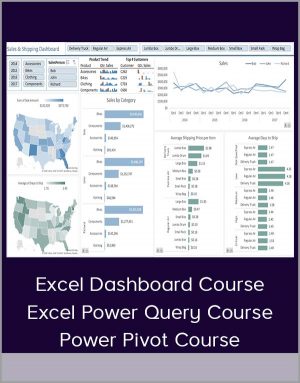
Excel Dashboard Course + Excel Power Query Course + Power Pivot Course
$92.00$797.00 (-88%)
apply to your charts and I show you exactly which parts of the VBA to edit.
Excel Dashboard Course + Excel Power Query Course + Power Pivot Course
Do your Excel reports take a long time to update each month/week?
Do you spend hours collating data, updating formulas and charts and then feel like no one reads them anyway?
It doesn’t have to be that way.
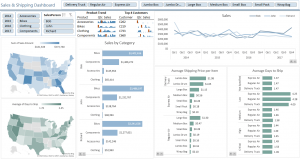
In my Excel Dashboard course I teach you how to create amazing interactive Excel dashboards, like the ones below, that update with the click of the Refresh button, or with a simple copy and paste of your new data into your spreadsheet. They’ll wow your boss and take your career to the next level.
So, what is an Excel Dashboard?
An Excel Dashboard provides insight, analysis and alerts. They’re fully interactive and dynamic and can help with project management, customer service, retail management, financial forecasting and much more.
Key features:
- Usually fits on one page
- Displays key trends, comparisons and data graphically or in small tables
- Provides the reader with conclusions to their objective
- Is often interactive allowing the user to filter data and switch views themselves
- Employs best practices that enable the report to be updated quickly and easily (often at the click of just one button)
What the Excel Dashboard Course Will Do For You
This comprehensive Excel Dashboard Course will teach you the simple techniques you can apply in Excel to make killer dashboards that will set your skill level apart from the crowd.
I teach you how to build Excel Dashboard reports from the ground up.
By applying the simple rules I share with you, you will have the skills to be able to create reports that save loads of time (allowing you to go home early :)) and you’ll quickly become known as a Dashboard Superhero with reports that are:
-
- Quick and easy to update, in fact they can update themselves (imagine being able to confidently say that in an interview) by pulling in data direct from your external database, Microsoft Access, the web etc. at the click of a button if you set them up right (I show you how).
-
- Fully interactive so the reader can change the view themselves; they can filter by product, time period or any parameter you choose, they can show and hide data using check boxes, drop down lists, and option buttons to name a few.
-
- Easy to read and interpret; plus I share with you a heat map of your page that shows you where your most important data should go and where will get the least attention.
-
- Exactly what the reader wants; I teach you the 5 key questions to ask and to who in the planning stage of your report so you get it right first time.
-
- Choose the right chart for your data; I teach you over 20 charts and show you which type of chart will best display your data.
Just take a look at the two charts below. Both plot the same data but one is much easier to make comparisons in the data than the other. You be the judge.
- Choose the right chart for your data; I teach you over 20 charts and show you which type of chart will best display your data.
-
- Professional presentation. I teach you simple visualisation techniques so your reports will look like you’ve had a graphic designer involved even if you are completely lacking in artistic talent (like me).
-
- Animated. Some types of data are great displayed in an animation. Animated charts allow the reader to get an understanding of how data moves over time. In this course I share some VBA code with you that you can apply to your charts and I show you exactly which parts of the VBA to edit.
Watch the Course Overview Video
Or if you prefer, continue reading for more information on the course.
| For best viewing quality: press play then 1. click the cog and select 720p HD, and 2. click the icon on the bottom right of the video to view in full screen. |









Reviews
There are no reviews yet.