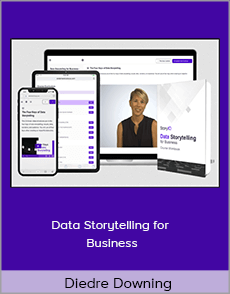
Diedre Downing – Data Storytelling for Business
$20.00$199.00 (-90%)
Data storytelling is an approach for presenting data in a way that is tailored to the needs of a specific audience. The best data stories are insightful, compelling and inspire the audience to take action.
Diedre Downing – Data Storytelling for Business

Check it out: Diedre Downing – Data Storytelling for Business
Master impactful data storytelling skills at your own pace through an engaging video-on-demand course
About the course
Data storytelling is an approach for presenting data in a way that is tailored to the needs of a specific audience. The best data stories are insightful, compelling and inspire the audience to take action.
Our Data Storytelling for Business course provides learners with a solid grounding in fundamental data storytelling learning concepts.
By the end of the course, learners will have the skills needed to produce impactful data visualizations layered with compelling narratives.
Meet your instructor
Diedre Downing is an accomplished educator and data visualization keynote presenter, bringing over 15 years of teaching and facilitating experience to the StoryIQ team.
Prior to joining StoryIQ, Diedre led the development of virtual training programs for over 100,000 educators as part of her 14-year tenure at the New York City Department of Education.
Course Curriculum
1. Welcome
- Course Introduction (1:26)
- Data Storytelling for Business Course Workbook
- About your Instructor
2. Putting your Audience First
- The Four Keys of Data Storytelling (2:58)
3. Visualization Design Principles
- Design Principles Introduction
- Chart Junk (5:24)
- The Cleveland & McGill Scale (5:13)
- Pre-Attentive Attributes (3:54)
- Gestalt Laws (4:58)
- Design Principles in Action (5:42)
- Design Principles Conclusion (1:11)
4. Data Visualization Best Practices Part I
- Data Visualization Design Introduction
- Impact Metrics (3:16)
- Tables (3:37)
- Bar charts (6:17)
- Pie Charts (3:05)
- Line Charts (3:13)
5. Data Visualization Best Practices: Part II
- Scatter plots (3:44)
- Small Multiples (2:04)
- Use of Color (8:59)
6. Workshop: Part I
- Step 1: Understand Your Audience (1:49)
- Step 2: Data and Visualizations (3:25)
7. Narrative
- Narrative Introduction
- Storytelling Titles (2:33)
- Vertical and Horizontal Flow (4:02)
- Presentation Medium (4:24)
- Presentation Assembly (3:13)
- Presentation Delivery (3:49)
- Course Conclusion (1:12)
8. Workshop: Part II
- Step 3: Preparing a Data Story (1:28)
9. How To Videos
- Line Chart Enhancements (7:58)
- Creating a Bullet Chart (4:31)
- Creating an Impact Metric (4:32)
- Creating a Slopegraph (4:08)
- Enhancing Bar Charts (3:36)
- Creating a Scatter Plot (5:40)
- Creating a Staged Line Chart (2:56)
10. Example Solutions
- Examples: Chart Enhancement Practice (3:24)
- Sample Yellevate Solution (4:34)


